The JPRO Commercial Vehicle 2023 Data Monitor is indispensable for tracking and analyzing your fleet’s vital statistics. It performs real-time monitoring of various vehicle parameters, diagnosing potential issues, optimizing fuel efficiency, and reducing maintenance costs. With this function, you can stay one step ahead of potential problems, ensuring your fleet operates smoothly.
Related Contents:
JPRO Noregon Commercial Fleet Diagnostics 2023 2021 Free Download
Noregon JPRO DLA 2.0 Adapter
The Data Monitor group’s messages into related categories by tabs located at the top of the Data Monitor window.
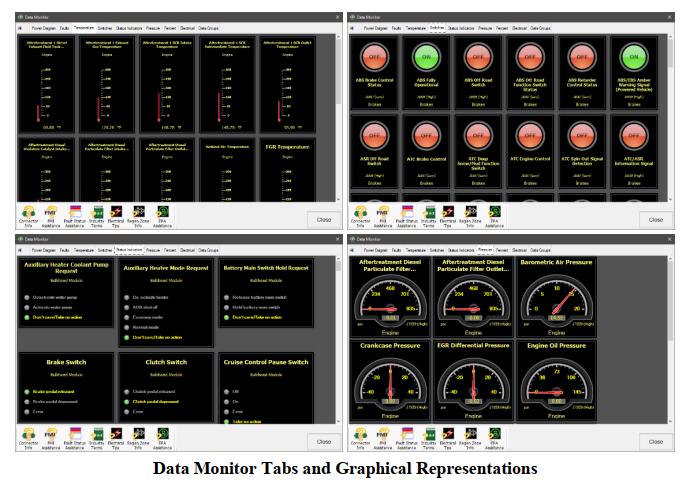
Many of these tabs use graphical representations for displaying parameter values.
1.Select Data Monitor button on the main toolbar.
2.The Data Monitor window is displayed and the initial view defaults to the All tab. The All tab displays all available data items from all components on the data bus.
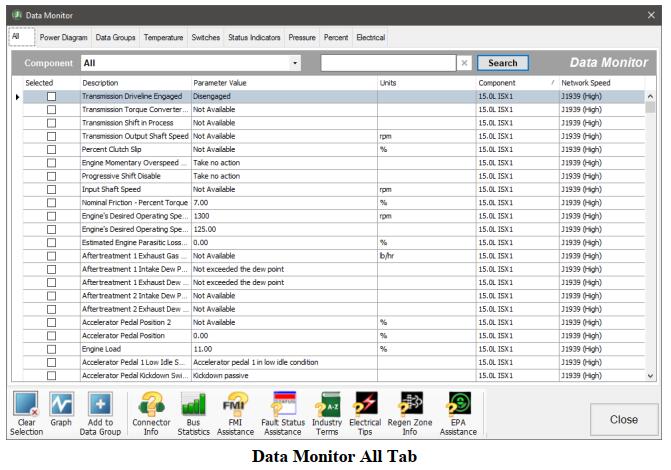
3.Other Data Monitor tabs include: Power Diagram, Faults, Temperature, Switches, Status Indicators, Pressure,Percent, Electrical, and Data Groups.
4.Filter the Data Monitor list by selecting any component from the drop-down list at the top of the window.
5.Data Monitor items can be quickly found by typing in search criteria and clicking the Search button. Results will be displayed for all items that have the search criteria in at least 1 column.
6.The Power Diagram tab will display a graphical representation of the reported voltages for the various modules of the vehicle. This is to aid in the diagnosis of electrical problems.
7.Low voltages will be indicated by a red blinking highlight. An indicator may display next to ECUs with electrical faults. A red exclamation indicates active faults. A yellow triangle indicates inactive faults.
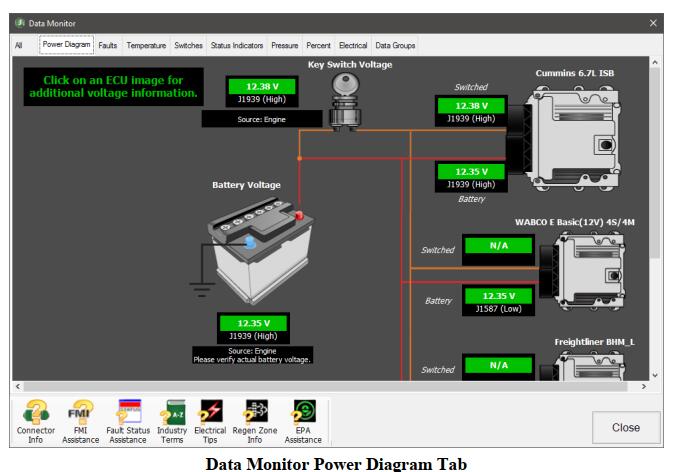
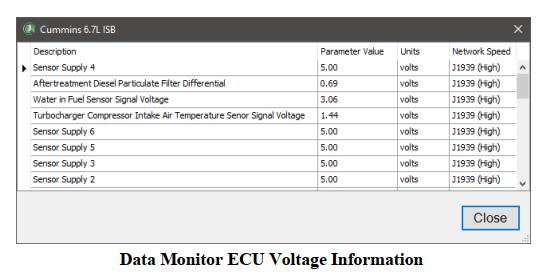
8.Select an ECU from the Power Diagram to see all electrical data reported by the selected ECU. Electrical data associated with a reported active fault will be highlighted red in the grid display. Data associated with inactive faults will be highlighted in yellow.
9.To view a graphical display of items in a specific category, select the Temperature, Switches, Status Indicators,Pressure, Percent, or Electrical tab.
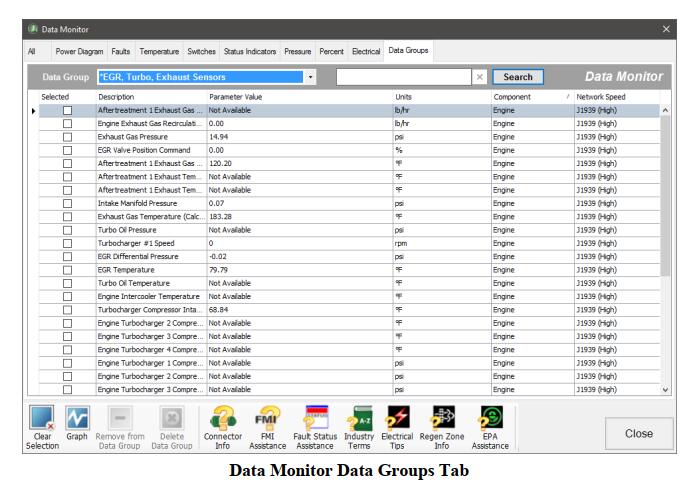
10.The Data Group tab will display defined sets of data. Noregon provides pre-defined sets of data to aid in the troubleshooting of electrical problems and common performance complaints. You can create custom user defined sets of data as well.
Data items that are available on the current vehicle will be displayed when the named group is selected in the Data Group dropdown.
11.To add a data item to a custom user defined Data Group, simply select the ‘Selected’ checkbox on the All tab and then select the Add to Data Group button. The Add Parameters to Group window will display.
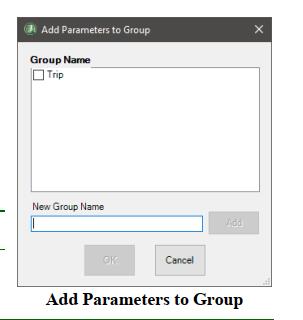
Provide the group name or select from the list of previously defined groups.
Selecting the OK button will then add the selected data items to the selected groups.
NOTE: Pre-defined Data Groups cannot be edited.
NOTE: Selected data items are component and protocol specific. For example, adding Battery Voltage will not automatically display Battery Voltage reported by every component. Only the selected components Battery Voltage from the selected protocol would display in the Data Group.