Launch X431 PAD V is the most latest advanced diagnostic tool from Launch. On the basis of Launch X431 other series, PAD V made new improvements and support more powerful functions.
Through the wireless communication between VCI device and the tablet, it achieves full car model and full system vehicle trouble diagnosis, which include Reading DTCs, Clearing DTCs, Reading Data Stream, Actuation Test and Special Functions.
Moreover, taking advantage of the mobile Internet, it also integrates One-click Update, Remote Diagnosis which helps to diagnose vehicle issues more efficiently, and greatly increase customer’s retention and boost shop revenue.
This tool adopts a higher performance-price ratio display tablet, which comes loaded with two Wi-Fi modules, powerful 8-core 2GHz processor, 4G RAM, and a 10.1” sunlight readable capacitive touch screen with a resolution of 1920 x 1200 pixels.
Features:
1.Diagnose:
•Smart Diagnosis: This module allows you to use the VIN information of the currently identified vehicle to access its data (including vehicle information, historical diagnostic records) from the cloud server to perform quick test.
•Local Diagnosis: To perform diagnosis by executing on-screen commands step by step. Diagnosis functions include: Read DTCs, Clear DTCs, Read Data Stream, Special Functions etc.
•Remote Diagnosis: This option aims to help repair shops or technicians launch instant messaging and remote diagnosis, making the repair job getting fixed faster.
•Maintenance & Reset: All kinds of common maintenance and reset items including Oil lamp reset, DPF regeneration, ABS bleeding can be done.
•One-click Update: Lets you update your diagnostic software online.
•Diagnostic History: Provides a quick access to the tested vehicles and users can choose to view the test report or resume from previous diagnostic session, without the necessity of starting from scratch.
•Pre- and Post- Repair Result Comparison: By comparing the pre- repair and post-repair report, you can clearly determine which vehicle issues have been fixed and which remained unsolved.
•Diagnostic Feedback: Enables you to submit the vehicle issue to us for analysis and troubleshooting.
•Toolbox: Scopebox, Sensorbox, Batterybox and Videoscope (sold separately) are available for extending the functions of the tablet.
•Vehicle Coverage: Quick dial to view the vehicle models that the tablet covers.
2.WLAN connection is supported.
3.ADAS calibration: Optional. This function needs to be activated before normal use and only works with the LAUNCH-specific ADAS calibration tool.
4.Web browser: Users can make online search and visit any website.
5.File Manager: Lets you manage files or downloaded files stored in memory card efficiently.
6.Settings: To configure your personalized tablet.
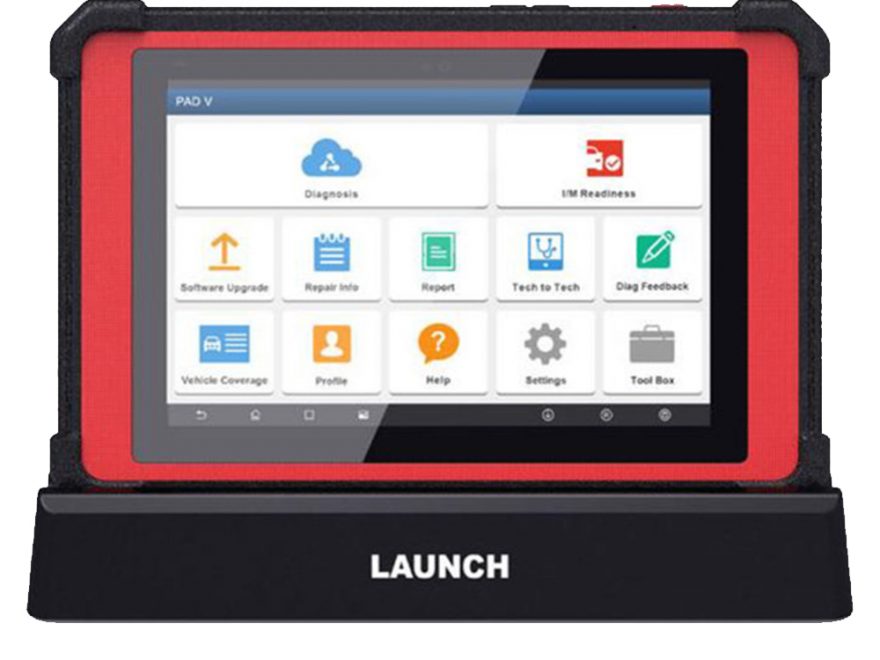
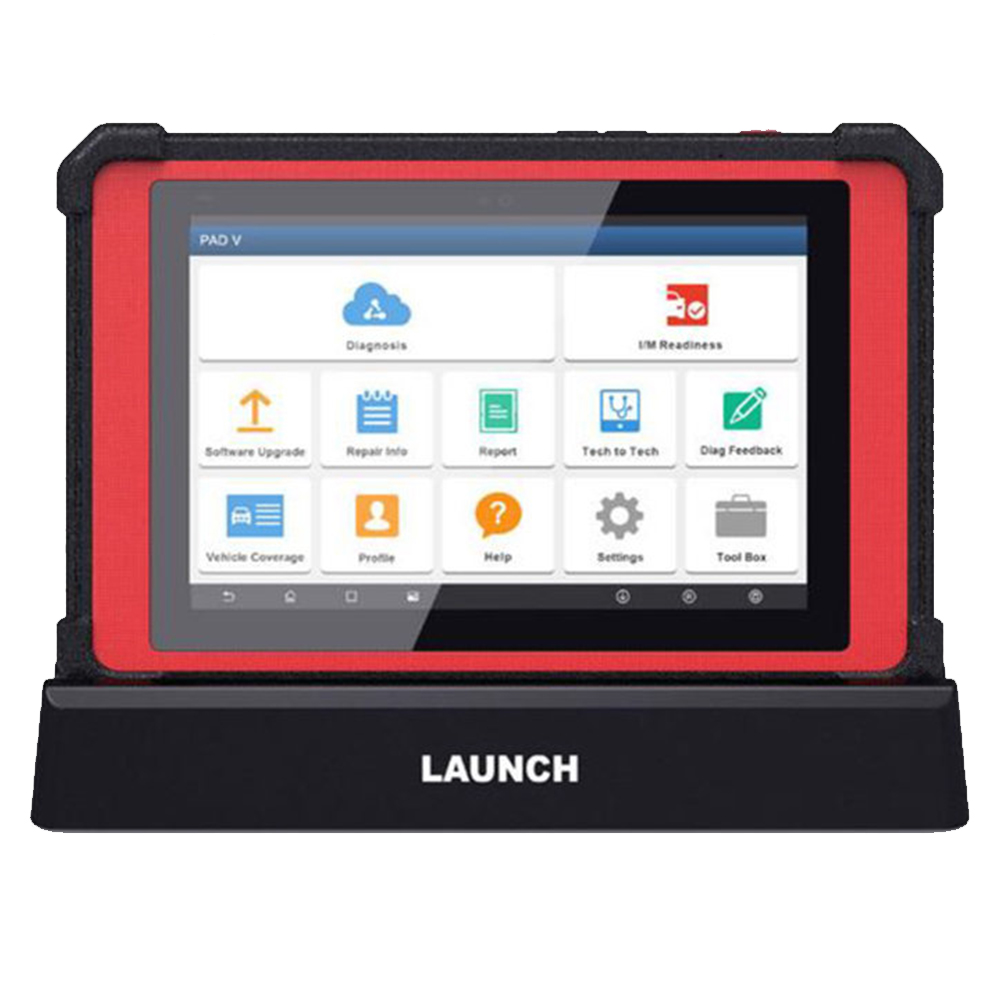
LAUNCH X431 PAD V Display:
HOW TO PERFORM MANUAL VEHICLE DIAGNOSIS BY LAUNCH X431 PAD V:
Come to the Home screen, go to “System Selection” option (PS: This option allows you manually select the test system and function step by step.)
tap “System Selection”, the screen displays as follows:
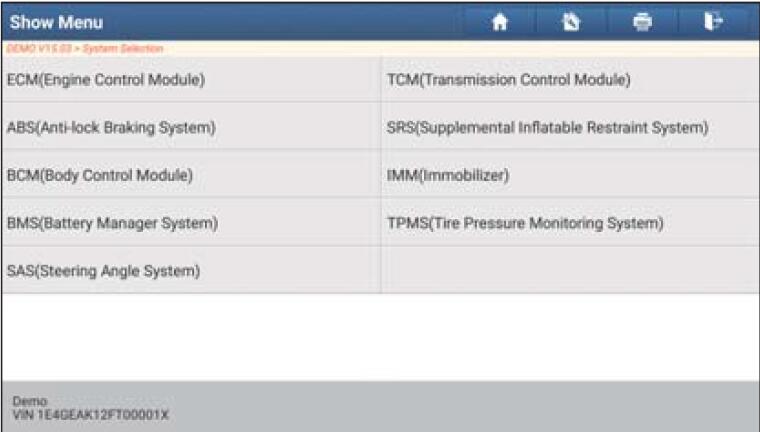
Swipe the screen from the bottom to view the vehicle system on the next page.
Tap the desired system (take “ECM” for example) to jump to the test function page. (PS: Different vehicle has different diagnostic menus.)
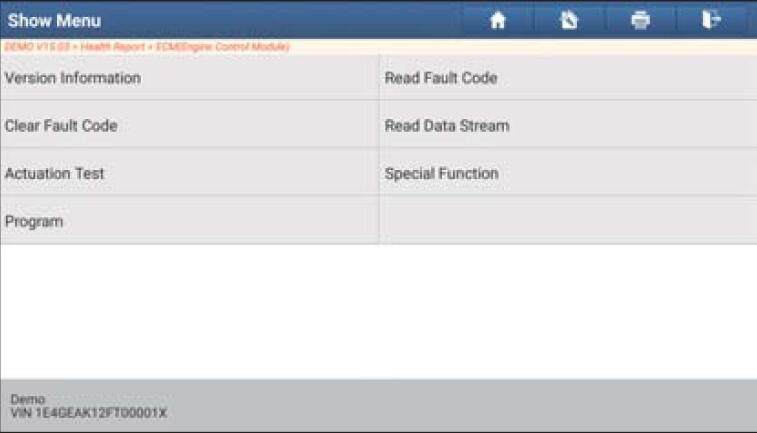
In the following content, the manual vehicle diagnosis tutorial will be explained from four main parts:
A.Version Information
This function is used to read the version information of system mode,
vehicle VIN, software and ECU.
Tap “Version Information”, the screen displays as follows:
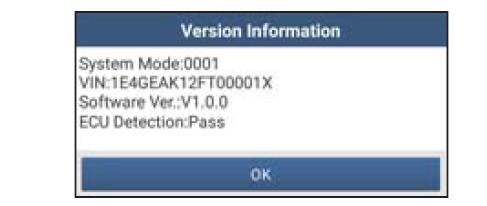
Tap “OK” to confirm and exit.
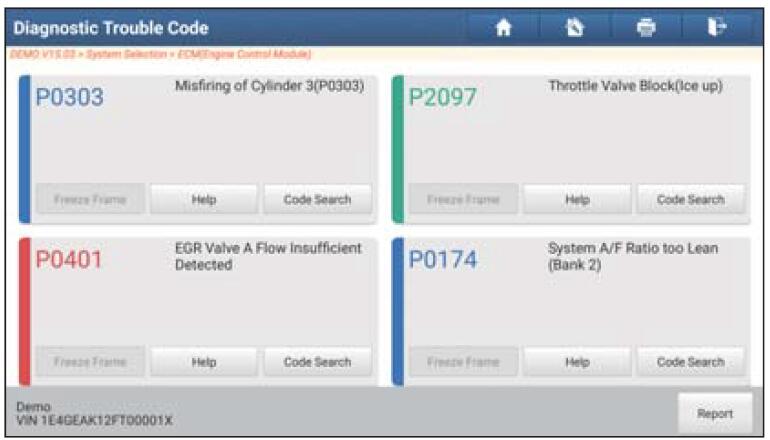
B.Read Fault Code
This function displays the detailed information of DTC records retrieved from the vehicle’s control system.
Tap “Read Fault Code”, the screen will display the diagnostic result.
Important Message:
Retrieving and using DTCs for troubleshooting vehicle operation is only one part of an overall diagnostic strategy. Never replace a part based only on the DTC definition. Each DTC has a set of testing procedures, instructions and flow charts that must be followed to confirm the location of the problem. This information can be found in the vehicle’s service manual.
Next, let’s see how the on-screen buttons in manual diagnosis works?
Freeze Frame: When an emission-related fault occurs, certain vehicle conditions are recorded by the on-board computer. This information is referred to as freeze frame data. Freeze frame data includes a snapshot of critical parameter values at the time the DTC is set.
Help: Tap to view the help information.
Code Search: Tap it to search for more information about the current DTC online.
Report: To save the current data in text format. All diagnostic reports can be accessed from “User Info” -> “My Reports” -> “Diagnostic Report”.
C.Clear Fault Code
After reading the retrieved codes from the vehicle and certain repairs have been carried out, you can use this function to erase the codes from the vehicle. Before performing this function, please be sure the vehicle’s ignition key is in the ON position with the engine off.
Clearing DTCs does not fix the problem(s) that caused the code(s) to be set. If proper repairs to correct the problem that caused the code(s) to be set are not made, the code(s) will appear again and the check engine light will illuminate as soon as the problem that cause the DTC to set manifests itself.
When you tap “Clear Fault Code” under the “Show Menu” interface, a confirmation dialog box pops up on the screen. Tap “Yes” and the system will automatically delete the currently existing trouble code.
Important Message:
After clearing, you should retrieve trouble codes once more or turn ignition on and retrieve codes again. If there are still some trouble codes in the system, please troubleshoot the code using a factory diagnosis guide, then clear the code and recheck.
D.Read Data Stream
This option lets you view and capture (record) real-time Live Data. This data including current operating status for parameters and/or sensor information can provide insight on overall vehicle performance. It can also be used to guide vehicle repair.
Important Message:
If you must drive the vehicle in order to perform a troubleshooting procedure, ALWAYS have a second person help you. Trying to drive and operate the diagnostic tool at the same time is dangerous, and could cause a serious traffic accident.
When you tap “Read Data Stream” under the “Show Menu” interface, the system will display data stream items.
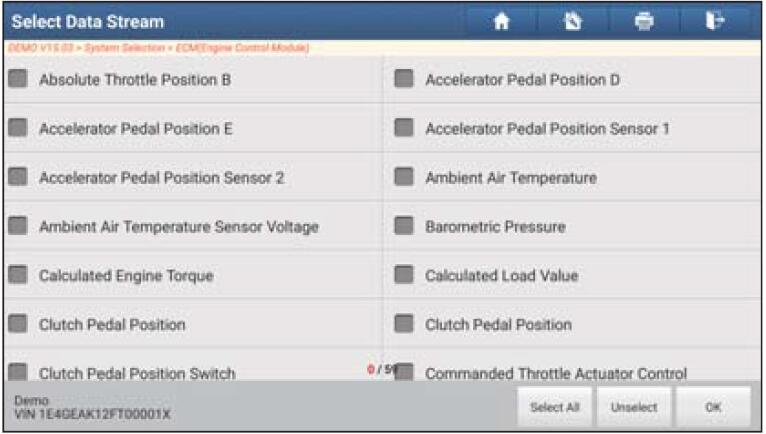
Again, get to know the instruction of On-screen Buttons:
Select All: Tap it to select all items of the current page. To select certain data stream item, just check the box before the item name.
Unselect: Tap it to deselect all data stream items.
OK: Tap it to confirm and jump to the next step.
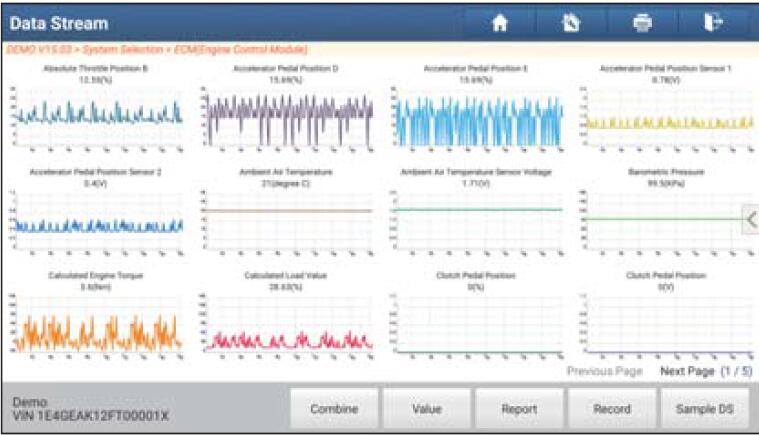
After selecting the desired items, tap “OK” to enter the data stream reading page.
Important Message:
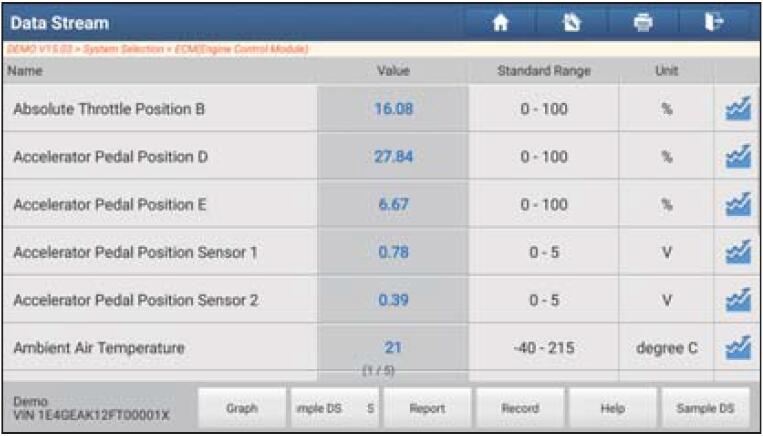
If the value of the data stream item is out of the range of the standard (reference) value, the whole line will display in red. If it complies with the reference value, it displays in blue (normal mode).
The indicator 1/X shown on the bottom of the screen stands for the current page/total page number. Swipe the screen from the right/left to advance/return to the next/previous page.
There are 3 types of display modes available for data viewing, allowing you to view various types of parameters in the most suitable way.
Value – this is the default mode which displays the parameters in texts and shows in list format.
Graph – displays the parameters in waveform graphs.
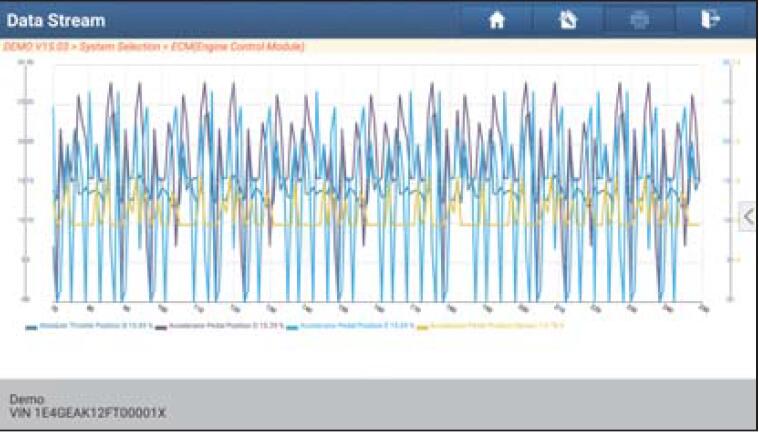
Combine – this option is mostly used in graph merge status for data comparison. In this case, different items are marked in different colors.
Once again, get to know the instruction of On-screen Buttons:
Graph: Tap it to view the waveform.
Combine: This option is mostly used in graph merge status for data comparison.
That’s all. Thank you for sharing your time with us!